

When I run quantitative demonstrations for algebraic kinematics, I use the PASCO projectile launcher. I know that it gives a consistent 4.8 m/s initial speed, I know free-fall acceleration, and I can easily measure distance to verify quantitative predictions.
Today I wanted to create a set of quantitative predictions that students can work on independently, with experimentally verifiable results. I only have one projectile launcher, though -- they're $349 a pop. But how else to produce an experiment with known initial speed or acceleration?
While I'd prefer to have students manipulating the equipment themselves, the next-best alternative might be video of me using the same carts, tracks, and motion detectors that my students are already accustomed to playing with.
So this morning I gang-pressed my ten-year-old (who is, obviously, much more tech-savvy than I) into taking a bunch of videos of me using a motion detector to make velocity-time graphs for twelve carts. All twelve involve either motion at constant speed; speeding up from rest; or slowing down to rest. I've put pictures of the velocity-time graphs into a single file at this link. Or, you can look at the unaltered pictures of the full labquest result -- with both position-time AND velocity-time graphs -- that I posted on twitter. Look up @gregcjacobs on 31 December 2013.*
*Yes, the pictures are rather dark... I couldn't get the labquest lit nicely for a picture without causing glare. If you can touch these pictures up and send me a new file, that would be awesome.
The twelve videos that go with the velocity-time graphs are available by searching "Jacobs Physics Accleration Video" at youtube, or clicking on this youtube link. (Video credit for all twelve goes to Milo Jacobs.)
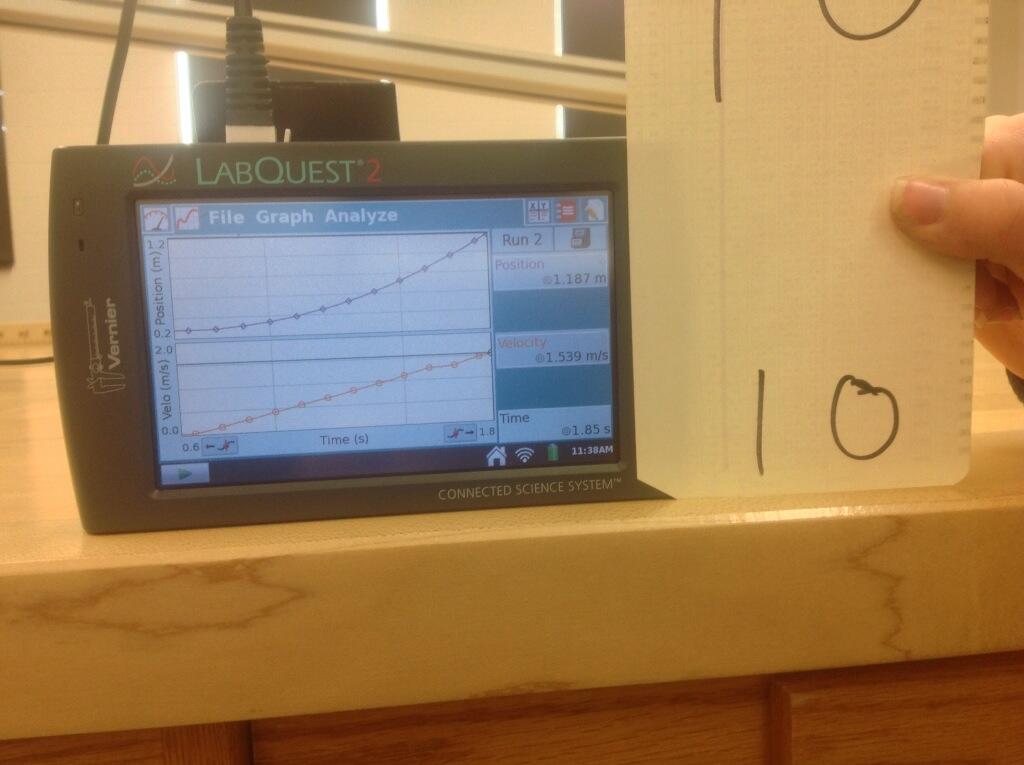
What exactly will I do with these graphs and accompanying videos? Well, a lot is possible. The simplest idea would be to ask a student to use the velocity-time graph to determine the distance the cart traveled in a video. For example, v-t graph #10 -- picture above for convenience -- shows a cart speeding up from rest for 1.2 s to a max speed of 1.5 m/s. Using kinematics, you can calculate an acceleration of 1.3 m/s per second, and a distance traveled of 90 cm.
Then in video #10, you can pause the video and estimate the distance the cart traveled down the plane. While the meter sticks below the track are not in enough focus (and are not aligned with the track's slope) to determine a distance to the nearest centimeter, I can see well enough to count about 10 decimeters -- i.e. 100 cm -- of motion from release until the cart hits the bottom of the incline.
If you want four-sig-fig precision, please use a java motion simulator. And if you want professional videos in which the performer has the skill to notice that the blue cart doesn't contrast well with his shirt, well, please get in touch with a professional videographer. This is the best that Milo and I can do... and I very much like the quality. Part of laboratory work is discovering the limits of said lab work. My hope is that by the end of the year my students understand that kinematics equations can make predictions within about 10-15% for most any situation in the physics classroom.
Please feel free to use the graphs and accompanying videos, or to make better ones. I will post someday once I flesh out the google doc with specific questions about the motion represented by each graph.
Next step: adapting the graphs and/or videos to make a set of QUALITATIVE exercises for conceptual physics.
No comments:
Post a Comment