I've been working this year on developing laboratory exercises for general physics that involve simple data collection and straight lines. I want to drill the idea of taking a slope of a best-fit line, and interpreting the physical meaning of that slope.
I've already discussed the classic ball-off-of-a-table projectile lab, for which David Moore recommended using a photogate to measure the ball's horizontal speed. The traditional experiment controls for the horizontal speed, and asks students to predict the landing spot on the floor.
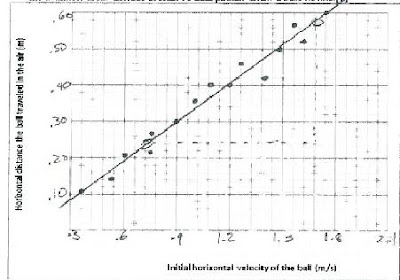
I tried something different, because I wanted a graph. I had the students measure the initial horizontal speed with the photogates... but then I had them measure the horizontal distance that the ball travels after flying off of the table. They could make these measurements for a wide range of initial ball speeds. I asked them to graph the landing distance on the veritical axis of a graph, and the velocity read from the photogates on the horizontal axis.
My class did a pretty good job of data collection. At this point, they're already quite good at drawing a best-fit line, at calculating the slope of the best-fit using two points on the line that are not data points. Some even put proper units on the slope. (The idea that a slope has units is, for some reason, a difficult concept to get across.)
What we're NOT yet good at is understanding the physical meaning of the slope of an experimental graph.
When I ask someone what the slope of this graph means, he invariably says "the slope is the change in the distance divided by the change in the speed." Well, sure, but that's a mathematical answer. I know that a slope is rise over run. What's interesting and exciting is that the slope has a meaning beyond rise over run, which can only be determined with reference to the relevant equation.
The horizontal speed is constant; so speed = distance / time. Some algebra rearranges this to time = distance / speed. Well, distance / speed in this case is rise / run -- The slope is the time for the ball to fall to the ground.
One student's data is shown above. The slope of his graph was 0.37 s. The table from which he launched the ball was 72 cm high, predicting a time of fall of 0.38 s -- not bad, eh?
GCJ


Regarding interpreting the slope:
ReplyDeleteI have found success with this when 2 things happen:
(1) There is at least one other graph with data yielding a different slope
(2) Students are asked to state the meaning of the slopes of those graphs in a more concrete way first.
So, if I did your lab, I might present my kids with an additional graph generated by data from the class in the other physics room. Or kids from another school. Or, better yet, all the lab groups within my class share their graphs with the whole class on whiteboards.
I'd ask each group what their specific slope meant. In the case of your graph, my students would say, "For every 1 m/s the speed of the marble is increased, the marble lands 0.37 m further from the edge of the table." Another group might say, "For every 1 m/s the speed of the marble is increased, the marble lands 0.45 m further from the edge of the table."
Then I'd ask why are the slopes different? Why would 2 marbles with the same speed land different distances from the edge? Higher table = more time to hit the ground.