25 February 2015

Two new labs for AP Physics 1 waves

I was asked via email how I've dealt with waves in AP Physics 1.  Remember, my approach will change over the years, as I see the sorts of things asked on the exam, and as I get new ideas from shop talk.  For now, I've started by teaching AP Physics B waves, with a bit more detail about how standing waves are formed, and no credit for just mimicking the equations fn=nv/2L etc.  In order to develop a deeper understanding of standing waves, I tried two new labs this year:

(1) I used the pasco wave generator at the constant 60 Hz frequency attached to a long string.  The string was attached over a pulley, with a hanging mass providing a tension.  I had students change the tension (which changes the wave speed), and measure the wavelength of the resulting standing wave from node-to-node-to-node.  

So we didn't spend years pounding the calculator, I provided a lookup table mapping each hanging mass to the correct wave speed.  I used excel ahead of time with the linear density of the string that I measured and the equation v = root ((tension) / (linear density)).  This graph is linear; the slope was 60 Hz, which was the frequency of the generator.  Each group matched the 60 Hz frequency within their determined uncertainty.

The real pedagogical purpose of this experiment was to give students kinesthetic experience with standing waves.  I did not introduce harmonics to the class before this experiment!  We only discussed how standing waves are the result of interference between periodic waves traveling in opposite directions in a fixed space; and I showed them that the wavelength was twice the size of one "hump."  They found out for themselves that sometimes these standing waves didn't form -- they had to move the generator left and right to adjust the string length in order to get the standing waves to show up.  That was a nice transition into harmonics, and to the next experiment.

(2) I used adjustable-length pipes, open at both ends, with an iphone frequency generator to produce resonance in the tubes.  Each group plotted their pipe length at resonance vs. the frequency of the generator, changing the freqency in small increments so as to remain at the same harmonic.  Each group was then asked to make a linear plot from which the harmonic number that they used could be determined.  

Since we did this experiment after the one described above, it reinforced the condition under which standing waves occur.  When on subsequent homework a student was confused about standing waves questions, I explained in terms of these two experiments -- the pipe didn't resonate except at one or two special lengths, just like the string didn't show the humps unless you got the string length just right.  And just as you could lengthen the string by exactly one hump and get standing waves again without changing the frequency, you could lengthen the pipe for the same frequency and get another resonance.  How far would you need to lengthen the pipe?  One "hump" in the standing wave, i.e. 1/2 wavelength.

Now, there's more to be done, of course, but this is where I started.  In Physics B I might have done the first of these labs; I have more time in the new course, so I added the second.

As for homework or test questions to ask... check out the experimental question from the 2012 Physics B exam.  It proposes a similar experiment to number 2 above, but asks for a determination of the speed of sound.  That's a good follow-up a couple of weeks after the waves unit.
16 February 2015

White Paper from the AP Development Committees: "Paragraph Response" Expectations

The College Board has published several paragraphs detailing what the readers will be looking for in answers to "paragraph response" questions.  Take a look here.  I don't have much to add to their statements, which I think are clear and useful.  I will likely pass out their page-long discussion for my students to read during our exam review.  

The two points I'd highlight:

(1) "It should make sense on first reading."  Your students don't get to come to Kansas City in order to follow their exam from reader to reader saying "let me explain what I meant."  You only get one shot -- do not miss your chance to blow the reader away with your logical arguments.

And thus, in your class, don't allow a student to argue about his score on this kind of problem.  If it didn't make sense to you ON FIRST READING, it's wrong -- and you have backup on that point from the AP Physics Development Committee itself.

(2) "Full credit may not be earned if a paragraph-length response contains...: 
* Principles not presented in logical order
* lengthy digressions within an argument
* primarily equations or diagrams with little linking prose."

In other words, it's a paragraph -- use your words, younglings, and stay focused.  You can not earn credit by throwing everything that comes to mind at the wall and hoping something sticks.

The College Board has released one paragraph-response question each for AP Physics 1 and 2, in the free response section of the practice exam.  I have one more about static equilibrium that I wrote for my tests that I'd be happy for someone to post on PGP-secure -- please, someone email me, I'll send you the file, and you can post it for me.  Anyone else have good, vetted paragraph response problems?  

GCJ

14 February 2015

First exercises in rotation: Newton's Second Law and Rotational Inertia

At this point in AP Physics 1 for upperclassmen, students are used to the idea that a new topic brings new facts and equations, which are then applied to make predictions to be verified experimentally.  Rotation provides an opportunity to introduce the topic directly with individual laboratory exercises, especially since the concepts of inertia, force, and acceleration are already familiar.  We are simply applying the concepts to a rotational setting.  

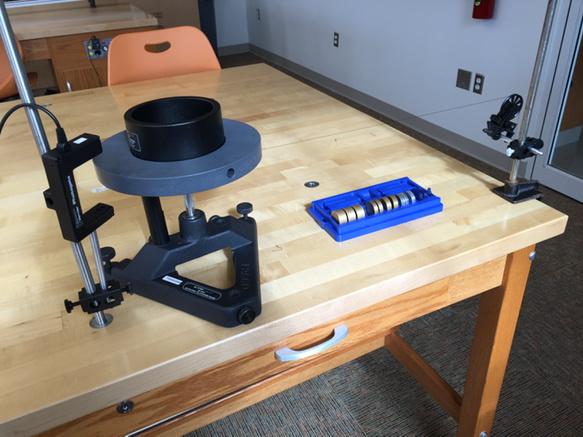
I spent way too long creating three versions of the pictured setup.  An object of mass between 10-200 g hangs from a string, which is passed over a pulley and wrapped around an axle.  The axle is attached to a wide and massive disk.  The hanging object is released from rest, causing the disk to accelerate rotationally.  I have the expensive PASCO version; a similar apparatus can be created for just a few dollars from PVC pipe placed over a ringstand, kind of as shown on problem 3 of the 2001 AP Physics C Mechanics exam.

A set of seven exercises is available for you to download and try out at this link.  I hand out the first to everyone, and help each student create an angular velocity vs. time graph for the rotating disk.  Then, each student individually, with his own unique graph, answers each of the questions, getting my approval before moving on to the next one.

Creating that ω vs. t graph requires some ingenuity.  The simplest way is to use the smart pulley and photogate; in fact, the PASCO apparatus provides a screw specifically aligned so that the photogate can easily be placed just right.  Problem is, I have Vernier photogates, which conveniently don't fit with the PASCO equipment.  D'oh.

So I set up a photogate vertically, a bit more than one disk-radius away from the rotational axis.  I cut a piece of paper such that its width was a known angle -- I calculated that with the 11.7 cm-radius disk, a 0.9 cm width paper subtends an angle of 0.08 radians.  Don't ask me why I chose that value -- I did, it works, and now I ain't gonna do any more cutting and taping.  (You can check my math, though.   Using x = rθ, 0.9 cm does in fact equal 11.7 cm times 0.08 radians.)  

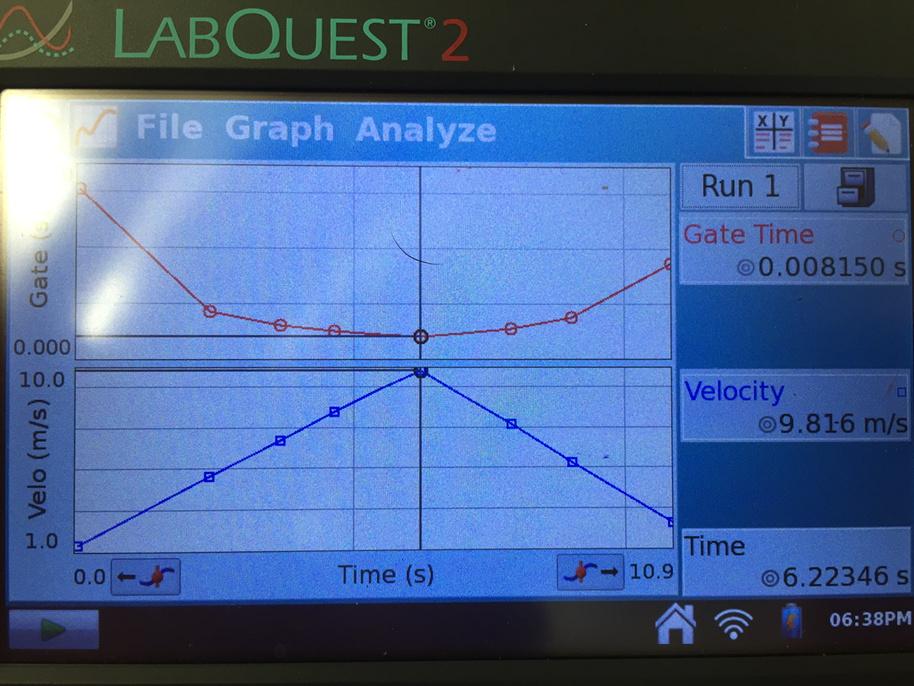
Next, I set up my labquest to read the photogate in "gate" mode, with a "distance" of 0.08 m.  Thus, the labquest thinks it's making a linear velocity vs. time graph in units of m/s.  I fooled it, though -- it's really making an angular velocity vs. time graph, in units of radians per second.


Once I finished the setup, the data collection was a breeze.  Students on their own could create beautifully linear ω vs. t graphs, as shown to the right.  Then they figured out to take the slope to determine the angular acceleration; they calculated torque with force times lever arm; and they calculated the rotational inertia of the disk.  I deliberately had half the class using the gray disk by itself, and the other half using the gray disk with a heavy ring on top; sure enough, the half of the class with the extra heavy ring calculated a significantly larger rotational inertia.


The subsequent exercises each ask the student to redo the experiment, changing one of three things:

(1) Changing the net torque by changing the hanging object's weight
(2) Changing the net torque by changing the lever arm
(3) Changing the rotational inertia by adding or removing the heavy ring

In each case, students predict the new angular acceleration using semi-quantitative reasoning, and then measure to verify their prediction.  Results are generally accurate well within 10% of the predictions.

Postcript:  Throughout these exercises, I'm making the approximation that the tension in the rope that provides the torque is equal to the weight of the hanging object.  This is not precise -- since the hanging object is accelerating downward, the tension in the rope is a big less than the weight of the hanging object.  So what.  When I do the precise calculation, I find that the effective rotational inertia of the whole system is increased by mr2, where is the hanging object's mass and r is the lever arm of 1-2 cm.  Since that is SO much less than the rotational inertia of the disk itself (where the disk's mass is significantly larger than m and the disk's radius is ten times larger than r), I've made a good assumption.  Eventually, when someone asks about the string's tension not being truly equal to mg (as someone did on Thursday), I can have a nice conversation.


05 February 2015

Use a quiz question to set up a lab investigation

I give daily quizzes with a variety of purposes.  And my lab exercises in AP Physics often involve creating a curved graph with direct data collection, followed by linearizing that graph.

Historically, I've struggled getting students to understand graph linearization.  Only a few students have truly understood how to figure out which variables go on which axes, and what the slope of the graph means.  Most of the class has needed multiple consultations with me and with their friends to get each experiment done; and more often than not they haven't been able to reproduce their analysis later on.  Graph linearization is abstract and difficult.

This year, I made graph linearization a common topic for daily quizzes.  I started simply:  

 I make a graph of the net force experienced by an object on the vertical axis, and the acceleration experienced by the object on the horizontal axis.  What is the physical meaning of the slope of the graph?
I teach that we solve the relevant equation for the vertical axis... then using the equation y=mx+b, identify the y and x variables.  What's left is represented by the slope of the line.  In this case, the relevant equation is F=ma.  The vertical axis is F, the horizontal axis is a, so the slope is the cart's mass.

The biggest misconception is to deal with units not with variables in an equation.  Someone will get the answer right by saying "the units are N/(N/kg), which is kilograms.  That's mass."  Well, that sometimes works.  It sometimes is too difficult to mess with (i.e. for those who don't recognize alternate forms of units for N or m/s/s).  And it is very often wrong.

In the lab, a student releases cars from rest on an incline, and measures the distance they travel on the incline.  The relevant equation is x = vot + ½at2, with vo = 0. The student keeps the time of travel constant while changing the cart’s acceleration.  He graphs the distance traveled on the vertical axis, and the acceleration on the horizontal.  What is the meaning of this graph’s slope?

Now the vertical axis is distance x, and the horizontal axis is a.  That leaves the slope as (1/2)t2.  The student doing a unit analysis might get the t2 part, but he certainly won't get the factor of 1/2.

Things get even more complicated when I ask students to figure out for themselves what to graph.  But I'm still using daily quizzes to get them to practice -- primarily because I can do one every day or two, and give them instant and brief feedback on their answers.  

Last week I did the standard period-vs.-mass-of-a-spring experiment.  I have students collect period vs. mass data, then they linearize such that the slope of their graph allows determination of the spring constant.  When they're all done, I use my five-second spring constant measurement method to check each group's result.  

Try this quiz.  It asks directly what a graph of period vs. mass for a spring looks like.  (Learning to sketch the shape of a graph is a different skill that I'm also working on through daily quizzes.)  Next, it asks for a possible linearization and the meaning of the slope.  

Not only do we go over and grade this quiz for immediate feedback, we go straight into the lab to do the experiment.  I've primed my students' brains to know what to expect from the experiment.  Then when it's time to linearize, there's much less fussing than in previous years.  We just discussed the linearization, and for a grade, even.  Everyone paid careful attention (because they care deeply what grade they get on a quiz).  That doesn't mean everyone interprets their graph perfectly... but we're five stepping stones ahead of where we were in previous years, even though I've done fewer experiments in this style.  Quizzes work!

02 February 2015

USIYPT 2015 -- results, and problems for USIYPT 2016!


This past weekend, Woodberry Forest School hosted the 2015 US Invitational Young Physicists Tournament.  Nine schools from around the country and the world participated in "Physics Fights," ritualized discussions about research projects.  The teams included:


The Harker School, CA - CHAMPIONS

Woodberry Forest School, VA - Second Place

Rye Country Day School, NY - Final Four

Renmin University HS, China - Final Four

Nanjing Foreign Language School, China - Swartz Poster Session Champion

Pioneer School of Ariana, Tunisia

Shenzhen Middle School, China

Princeton International School of Math and Science, NJ

Phoenixville Area High School, PA

At the closing ceremony, the trophies are awarded, and then the teams are given their "homework assignment:"  The four problems for USIYPT 2016 were revealed.  

In 2016, the tournament will be held Jan. 29-30 at Randolph College in Lynchburg, VA.  Let me know if your school would like an invitation to participate, or if you would like an invitation to judge.  Problems include:

#1 --  Domino Toppling: On 6 August 2014, in Charlotte, North Carolina, a team from Prudential Financial broke the Guinness World Record for toppling the largest domino stone, measuring roughly 30 ft x 15 ft  x 3 ft.  Each domino in the chain had the same aspect ratio of 10:5:1.  Study this phenomenon, then design and construct a domino chain whose overall lateral length before toppling is 3 meters, that starts with a domino stone that you can hold in your hand, and will topple the tallest possible stone. You may change the aspect ratio of your domino stone chain, however all stones must have the same aspect ratio, and all stones must be constructed of the same materials and in the same manner. You must launch the initial, smallest stone with a gentle finger push that topples that stone.

#2 – Blender Lift: If you hold an immersion hand blender's blades under water in a beaker or pot or pail, under certain circumstances you can lift the beaker and the water by lifting only the hand blender as shown in the picture below.  Study this phenomenon for a wide range of the relevant parameters comparing your theory that explains the effect to the experimental results.  Predict the
maximum weight of water and container that your blender can lift and verify this prediction by experiment.


#3 -- Transformer Impedance Reflection: the recently posted YouTube video titled "Transformers – Experiments and Demos" (v=y0WrKT45ZZU) shows a demo at the 4 minute mark.  The demo purports to show that removing a light bulb in the secondary circuit of a transformer will cause a light bulb in series with the primary to turn off, i.e., "a impedance reflection." Analyze this demo and the published explanation of this effect (W. Layton  Transformer Impedance Reflection, The Physics Teacher 52 (7), Oct 2014, p. 426-427).  Provide theoretical and experimental evidence to explain or refute this effect.


#4 -- Bouncing Laser Beam: – a laser will curve and even bounce in a medium whose index of refraction decreases with height.  Although there are several ways to produce this medium, the photo below was created by pouring thick, transparent Karo syrup into a tank and then pouring water on top of the syrup.  Approximately 12 hours later, the bouncing laser beam can be observed.  Create this apparatus or a similar one, study the theory of this effect, and use your results to measure the index of refraction of the medium as a function of height from the bottom of the tank.