23 December 2010

The pejoritive connotation of the word "homework"


Bad dog from discoveryeducation.com

What does the typical American think of upon hearing the word "homework?"  While I have no psychomological evidence of this, I suspect that the word is generally considered to be synonymous with "rote drill," and has a profoundly negative connotation.  On one hand, this is silly -- homework in any subject does not have to consist merely of rote drill. 

(What's wrong with rote drill, anyway?  I don't see the National Association of Music Educators campaigning to stop making violinists learn their scales; I don't see the National Association of Football Coaches minimizing the importance of conditioning, blocking, and tackling drills.  Done properly, and with the correctly limited scope, rote drill at any level of any subject is an important part of learning.  Anyway.  Ahem.)

Physics homework in particular does not, or at least should not, generally consist of rote drill.  Homework problems are used for practice, sure, but students are practicing the skills of creative problem solving, they're practicing to eliminate their crazy misconceptions, they're practicing their ability to explain concepts with reference to a relevant equation... Doing the homework, and moreover doing homework problems seriously and carefully and correctly, is an integral part of learning physics.

Nevertheless, students do not always take homework seriously.  In some upper level physics classes in particular, these very smart students say, I don't need to practice, I can just perform on the test.  (Then they perform poorly on the test because they didn't practice, and they say physics is just too hard.)  How do we get students to pay attention to homework?

Well, it starts (but does not end) with the homework grade.  I put a score on homework problems every night or two.  This score explicitly counts for 30% of students' course grade.  Of course, even with that explicit carrot, my lower level students do not pay appropriate attention to the homework.  They turn in hastily done crap, then just sigh when they see that their answer was wrong.  It never occurs to them to check BEFORE class whether their answers were correct; it never occurs to them that it would be a good idea to understand WHY their answers were wrong.  So the grade itself is a necessary but not sufficient motivator.

At a Virginia AP physics workshop, a teacher reported that he was forbidden by his administration from counting homework more than a token amount toward the course grade.  While I stared open-mouthed in a state of flabbergastation, others chimed in that they were under the same restriction.  But one clever physics teacher in my workshop had a solution...

I don't call my assignments "homework" precisely to avoid the negative connotation.  I use the phrase "problem sets" or "nightly problems," and I regularly make the comparison to the English essay -- I'm asking for the equivalent of a couple of well-written paragraphs every night in an English class.  The woman in my workshop took my phrasing and analogy a step further.

"Just call the homework an 'assessment'," she said.  "English teachers are allowed to count a series of take-home writing assignments as equivalent to a test.  So, we do the same thing.  These problem sets are the precise equivalent to a writing assignment, so they will be counted just as the English department counts them." 

And perhaps that trick might help the students as well as satisfy the clueless administrator.  If a student hears "this counts as a test," his effort seems to double.  I've noticed that students will repeatedly make the same kinds of mistakes on homework problems, but if they get the same exact question wrong on a "quiz" in class, suddenly they start remembering.

Why does the psychology of "homework" seem to work against the legitimate goals of nightly assignments?  I don't pretend to know.  All I can do is make the observation, and then use the observation to the benefit of my class and my students.

GCJ

22 December 2010

Quiz -- elecric fields introduction


Electric Field Pic from thefullwiki.org

I introduce electric fields in an unusual way, one that's not consistent with any textbook. 

Most textbooks start with Coulomb's law for the force between two point charges.  Then, eventually, they define the electric field as the force per unit charge on a "test charge" in the field.  This is of course correct, and consistent with the way many seasoned PhD physicists think of the electric field.  Try explaining this to a 17 year old in his first physics class, though -- you might as well try to explain the infield fly rule to someone who's never seen baseball.*

* The infield fly rule is a closed book to many actual baseball players and coaches, too -- trust me, I'm an umpire.

I've found much more success presenting the concept of the electric FIELD as primary.  We begin with a full day's class on nothing but F=qE and the definition of the electric field.  And F=qE essentially *is* that definition.  F=qE gives the magnitude of the force on a charged particle in an electric field.  This force is in the same direction of the electric field for a positive charge; the force is opposite the electric field for negative charges.

Those ideas seem so, so basic... but it takes nearly a week of practicing before my students figure this out.  What do they do wrong?  Everything. 

* Label a point in space "point P," and say explicitly "There is nothing at point P but empty space, but the electric field at point P is 200 N/C to the right."  Then ask a student point blank:  "Is there a charge at point P?"  "Is point P positive or negative?"  "What is the force on point P?"  Merely getting folks to agree that a position in space does not have mass or charge, and cannot experience a force, is a MAJOR challenge.

* Now, put an electron at point P.  Verify with the class that an electron has a negative charge.  Ask about the direction of the electrical force on the electron.  Half the class will get this wrong... even though you just told them the rule about charges and electric fields!  Try it.  This is more complicated than you might think.

* No matter what you do, students will be confused about negative signs.  I tell them again and again: IGNORE NEGATIVE SIGNS when dealing with electric fields.  Neither a field or a force can be intrinsically negative.  Use F=qE to determine the amount of a force or field; then use the rule about negative charges to determine a relevant direction.

* The electric field does not determine the direction of a charge's MOVEMENT.  This is a holdover misconception from mechanics -- force and velocity are independent of one another. 

So on the first night of electric field study, I break my rule about assigning only two AP-level problems per night.  Instead, I assign six plug-and-chug F=qE problems.  All I'm looking for are the basics -- can students state magnitudes and directions of electric fields and forces.  See, that's more than half the battle in electrostatics.  If we can bust these misconceptions, then perhaps the ideas of parallel plates and point charges won't be so impossible.

Below is the quiz I gave after this first night of homework.  You might think this is "too easy" for an AP class -- but no, it's actually on or above their level after the first night of electrostatics.  And, I could give this at the end of the year, and I would not expect anything close to perfection from a class of students who will mostly earn 5s.  Electrostatics is HARD and ABSTRACT.  Anything we can do to simplify, we should do.

GCJ


1. An electric field points right. What is the direction of the electric force on a +3μC charge in this field?

(A) positive
(B) negative
(C) Left
(D) Right
(E) None of the above, the force is zero.

2. An electric field points north. What is the direction of the electric force on an electron in this field?
(A) North
(B) South
(C) positive
(D) negative
(E) None of the above, the force is zero.


3. A 500 N/C electric field points left. What is the electric force on a -2 μC charge in this field?
(A) 1000 μN
(B) 1000 μN left
(C) 1000 μN right
(D) -1000 μN
(E) Zero


Questions 4-5: An electric field points to the right. An electron enters this field while moving to the right.

4. Which way is this electron moving immediately after entering the electric field?
(A) right
(B) left
(C) positive
(D) negative
(E) nowhere, the electron is not moving

5. Which way is this electron forced when it enters the electric field?
(A) right
(B) left
(C) positive
(D) negative
(E) nowhere, the electron is not forced

Questions 6-8: The charge on an electron is 1.6 x 10⁻¹⁹ C; the mass of a proton is 1.7 x 10⁻²⁷ kg. A proton is placed in an upward electric field of 200 N/C.

6. What is the direction of the electric force on the proton?
(A) Up
(B) Down
(C) Positive
(D) Negative
(E) None of the above, the force on the proton is zero.


7. Which is bigger, the electric force or the gravitational force on the proton?
(A) The electric force
(B) The gravitational force
(C) The electric and gravitational forces are about the same.


8. How many times bigger is the bigger force?
(A) 109 times
(B) 106 times
(C) 103 times
(D) 100 times


21 December 2010

Mail Time: Waves and sound on the AP physics B exam

Paul Dugas, of Woodbridge, VA, writes:

I was wondering about the waves and sound portion of the AP B curriculum.  The description is very short.  In looking at some past AP questions, there are some detailed sound interference pattern questions and sound intensity as a function of time.  The equations for intensity do not appear on the equation sheet AP gives to students.  Do you teach these concepts and, if so, how much time do you spend on them?

Certainly the double slit diffraction pattern for light, sound, and even subatomic particles has appeared on numerous exams. Students are expected to understand qualitatively how the intensity of a sound or light beam will vary on a screen when the wave is passed through a single slit, double slit, or diffraction grating. For the double slit / diffraction grating, they must be able to make the quantitative prediction of the location of the bright and dark spots.
 
I don't remember what intensity "as a function of time" question there might have been. 
 
The relevant principles here deal with light or sound intensity as a function of space.  And we don't have specific equations for a continuous I(x) function, but we know the locations of the bright and dark spots.  So we can fill in the blanks, knowing that a single or double slit diffraction pattern changes intensity gradually, while a diffraction grating produces sharp bright spots.

13 December 2010

Two-cart elastic collision -- how to measure the speed of both carts


I've taught conservation of momentum with the same set of quantitative demonstrations for years. I get two carts and a motion detector, make the carts collide, and predict speeds of the carts before or after the collision. Pretty basic, without much room for creativity. Until today, that is.

The first collision problem I attempt is very straightforward.  Take a look at the setup in the picture to the right.  I keep the red cart at rest, and send the heavier blue cart toward the red cart.  A velcro strip on the carts causes them to stick together after the collision.  The motion detector measures the speed of the blue cart before and after the collision.  I tell the class what the motion detector said the blue cart's initial speed was; we predict the speed of the combined carts after the collision.  Generally we get this prediction correct within 5-10%.
 
In the next collision, I push the blue cart toward the stationary red cart without the velcro, so that the carts bounce off one another.  Again the motion detector records the speed of the blue cart before and after the collision; we predict the speed of the red cart after collision.  Problem is, how should I measure the speed of the red cart to verify my prediction?  I pose that question to the class.
 
Most quickly understand why the single motion detector can only read the blue cart's speed.  The detector can't "see through" the blue cart. 
 
The solution suggested by a majority of students is to place a second motion detector on the left side of the track to track the red cart.  And I've tried that before.  But I've never gotten two facing detectors to work properly -- I think the sound waves interfere, causing nonsense results.  (Anyone else have any thoughts on this issue?)
 
What I've always ended up doing -- until today, anyway -- is to have students measure the time between the collision and when the red cart hits the end of the track, 100 cm away.  Since the track is level, the speed of the red cart is 100 cm divided by the time the students measure.  This works, but stopwatch measurement uncertainty causes this to be accurate only to about 20-30%, if that.
 
In today's class, junior Will Choate made the suggestion that I've missed for the last 15 years:  "Can you pick up the blue cart after the collision?  Then the detector can read the red cart."  That's IT!
 
So, I collided the carts.  After the collision, I gave the detector a brief moment to read the blue cart's speed, then I picked up the blue cart.  Sure enough, the velocity time graph showed the initial speed of the blue cart (47cm/s); the final speed of the blue cart (31 cm/s); a bunch of nonsense where my hand briefly got in the way; and the final speed of the red cart (80 cm/s).  We used conservation of momentum to predict that the red cart should have been moving 84 cm/s, within 5% of the measured speed.
 
The class was pleased with Mr. Choate for his creativity, and because he earned a TWO Reese's Cup reward.  I think much of the applause and congratulations was kissing up to Mr. Choate in case he felt inclined to give away his candy, but nevertheless.

07 December 2010

Quantitative demonstration -- Bernoulli's equation

Photo of my class by Frederic Lamontagne
A straightforward problem with Bernoulli's equation leads to a fun and dramatic demonstration, along with a fascinating discussion of the meaning of "negligible" and some use of the continuity equation.  Here we go...

I start with an empty tennis ball container.  With a pocket knife, I poke a small (<1 cm diameter) hole near the bottom of the container.  I show the class the container, and explain:  I'm going to cover the hole, and fill to the top with water.  The water clearly will shoot out of the hole.  What will the speed of this water jet be?

The class understands that a flowing fluid problem requires Bernoulli's equation.  So we write the equation:

P1 + rgy1 + ½rv12 =  P2 + rgy2 + ½rv22

Consider point 1 to be the top of the water, and point 2 to be as the water exits the container.  We want to find v2.  Let's see what terms can be cancelled or set to zero.

The water at the surface and at the exit is exposed to the atmosphere.  Any time a liquid, flowing or not, is exposed to the atmosphere, its pressure is atmospheric.  So the P terms cancel.

We can always take the lower y position to zero in Bernoulli or conservation of energy problems.  So get rid of the y2 term. 

Now we have a class discussion / argument.  Is the speed of the water at the top zero?  Certainly not.  But the water at the top is moving very slowly relative to the jet at the bottom.  So let's try setting that v2 to zero, and see what happens.

We measure the distance from the hole to the top of the container to be about 15 cm.  Solving Bernoulli's equation, we find the speed at the position of the hole to be 1.7 m/s.  Awesome!

But this is a quantitative demonstration.  We don't just solve the problem... we have to verify the answer.  How?  I can't just put a Vernier motion detector on the water jet.  The class brainstorms for a bit, and comes up with a great approach:  treat the water jet as a projectile.  Given the jet's initial horizontal speed of 1.7 m/s, we should be able to predict how far the jet will travel horizontally before hitting the ground.

What a great way to reinforce projectile motion problems, which we covered two months ago!  The horizontal acceleration is zero, the vertical acceleration is 10 m/s2, the vertical initial velocity is zero (because the jet comes out of the tennis ball container horizontally).  I place a large beaker on the ground to catch the stream of water; we measure the vertical distance from the top of the beaker to the hole in the container for use in the projectile problem.

When all is said and done, we calculated a 65 cm horizontal distance for the jet to travel.  While I filled up the container (and kept my finger carefully over the hole!), the students measured 65 cm along the ground and placed the large beaker at the correct spot.  I released the water....

... and the jet landed right in the beaker.  Physics works.

FOLLOW UP:  We all saw obviously that the speed of the water at the top was NOT zero.  But our prediction of a 1.7 m/s speed was accurate!  What's up?

We go back through the problem, this time not assuming that the speed at the top v1 is zero.  Instead, we use the continuity principle ( A1v1 = A2v2 ) to get another equation relating the speeds at top and bottom.  We can solve the two-variable system for the speed at the bottom.  We need to measure the cross-sectional area of the hole, and the area of the tennis ball can.  We find that the can has a diameter of about 7 cm, while the hole only is 1 cm wide.  Therefore the area of the can is 49 times that of the hole.  We resolve for the speed... and find that we still get 1.7 m/s.  Any difference would be in a later, very insignificant digit.  So, the speed of the water at the top is negligible compared to the speed of the water jet.


27 November 2010

Corrections to the AP Physics Sunken Ocean Liner Problem

Picture of the Andrea Doria from the Associated Press
The 2004 AP Physics B exam includes a clever problem combining kinematics and static fluids.  That's problem 2, linked here.  I assigned this problem on my trimester exam, and got reasonably good results. 

Anytime you're teaching a class of 37 students, though, you're going to have frustrations grading their exams.  SOMEONE is going to make the silly mistake you warned them about a million times.  Someone, somewhere, is going to lose five points out of fifteen because they didn't think properly under pressure, even though that same person will later slap his head and say "d'oh!"

I make my students correct their mistakes on all tests and exams.  The corrections process is not only pedagogically sound, it is cathartic to the physics teacher's soul, as well.  Some of the questions I ask on corrections are to point out the most common misconceptions, so that students can eliminate said misconceptions from their brains.  Other questions are designed less as a teaching tool than as a deterrent to future silliness.  When I grade the exams, and I scream to an empty room, "How can you fail to put units on an answer after three months of AP Physics?!!!!!" I find that I feel much better by designing a "deterrent" style test correction.  Here's what I mean.

Part (a) of 2004 B2 asked students to find the gauge pressure at the bottom of the ocean, given an absolute pressure of 413 atmospheres.  Those who missed this question usually couldn't recall the meaning of "gauge pressure."  So, the correction is pretty simple:

(a) Don't solve, just tell me briefly what is the difference between gauge and absolute pressure.

Part (b) required students to use the absolute pressure and the equation for pressure in a static fluid column to find the depth of the sunken ocean liner.  The most common mistake was to fail to convert properly from atmospheres to pascals.  That's not a huge deal to me.  Of greater consequence are the numerous students who get an answer of 41 m for the depth of the ocean, and don't recognize why that's so silly.  (The ocean liner itself is probably longer than that!)  So all I ask is:

(b) Explain in no more than two sentences why the answer “41 m” is physically unreasonable.
 
But the other major problem with parts (a) and (b), and with ALL parts of this question, is the students who write down 8 significant digits, or who fail to put units on their answers.  My students certainly know how to use proper sig figs, and they have been called out numerous times for lack of units.  On an exam, units and signifcant figures are a matter of focus, not of true understanding.  So, here's the correction I use.  Imagine reading this correction with an evil cackle:

If you lost points for units or significant figures here, or anywhere in this problem, write out in your own handwriting:  From now on I will be sure to write units on every numerical answer, and I will limit my answer to two or three significant figures unless the problem requires more significant figures.  And, the value “41,205,100 Pa” has six significant figures, which is too many.”

Ah, I feel better now.  And it works -- I've heard students saying to one another, "Hey, don't worry, I had to write that after our earlier test, and I made sure to put units on every answer this time."

The only other additional question I ask students in correcting this problem is in the last part, which asks for the time for the ocean liner to fall to the bottom.  Some students set up a single kinematics chart, with an initial velocity of 0 m/s, a final velocity of 10 m/s, and a distance equal to the depth of the ocean.  Problem is, they were told that 10 m/s is the terminal velocity of the ocean liner, which was reached after falling for 30 s.  So it's a two-step problem -- find how far the liner falls in the first 30 s while it's accelerating, then use constant-speed kinematics to find the time to fall the rest of the way.  I ask students to re-solve this problem, but first, they answer:

To find the time of sinking, why can’t you just make a kinematics chart with vo = 0, a = 0.3 m/s2, and Dx = 4200 m?

The goal, of course, is for students who got a part wrong to figure out their mistakes.  Just asking students to redo the same questions without acknowledging their misconceptions or articulating in words their mistakes is, while better than NOT doing corrections, insufficient.  These kinds of additional questions make corrections engaging and effective.

20 November 2010

The blessing and curse of an online timer

Whenever I give my classes a test or a quiz, I put a digital countdown of the time remaining up on the projector screen.  I found a nice web timer at


This timer is customizable as to the size and color of the digits, whether it counts up or down, even the sound or music that it plays at expiration. I like to set it for the hockey horn (HOOOOOOOOOOOOOOONK!) but often my students change to something a bit wimpier, like Pachelbel.  Go figure.

Particularly in my AP class, in which managing time on tests is a major issue, the timer display is a great teaching tool -- my guys have a clear knoweldge of the time remaining all the, well, time.  They get a kinesthetic sense of just how fast 80-seconds-per-multiple-choice-item is.  If nothing else, the timer saves arguments.  No one EVER says, "Can I have just one more minute?"  or "I thought we still had two minutes left." 

Even on occasions when I've given a test or quiz with a substitute present, the students take it upon themselves to put the timer up on screen.  It giveth them comfort.  And forgetting that fact was where I screwed up today.

We took our first trimester exam, but in an unfamiliar setting -- all of my students can't fit in my classroom.  I couldn't project the online timer.  "So what," I thought.  These guys are used to taking timed tests, and most have watches.  I reminded them before the start that the multiple choice section was 30 minutes long, and that they should manage their time to get to every problem for sure.

When the 30 minutes were over, even some of my best students looked bewildered.  They explained that they had lost track of time, because the screen didn't count down.  Thing is, EVEN SOME OF THE STUDENTS WHO HAD BEEN LOOKING AT THEIR WATCHES said they were confused about the time.  I've trained these folks to expect a scoreboard-style timer; they did not function well with a different sort of scoreboard.

For the free response section, they quickly arranged for a reliable student with a watch to call out time in ten-minute intervals.  I think they still wanted the projected timer. I mean, I'm glad the cutesy little timer is so useful, but I had never expected how inseparably reliant my class had become upon it.

GCJ

16 November 2010

Buoyant Force problem and demonstration with a crazy answer

A fluid mechanics problem I often assign is based on a problem from, I think, one of the older Serway editions.  It shows a beaker full of oil sitting on a platform scale.  A bar of iron is suspended in the oil from a rope which is attached to a spring scale.  The problem asks:

A 1.0 kg beaker containing 2.0 kg of oil (density = 916 kg/m3) rests on a platform scale. A 2.0 kg block of iron is suspended from a spring scale and is completely submerged in the oil.


(a) Which scale reading should be larger (or should they be the same)? Explain conceptually.

(b) When the iron is in equilibrium, what is the reading in the spring scale?

(c) When the iron is in equilibrium, what is the reading on the platform scale?

Most everyone gets the idea that the platform scale reads a bigger force -- after all, even without considering anything tricky (like fluid mechanics), the spring scale seems to read just the 20 N weight of the iron, while the platform scale seems to read the 30 N weight of the beaker/oil.  A bit more logic with buoyant forces convinces the students that the spring scale must read LESS THAN 20 N, because of the upward buoyant force on the iron.  No problem.
 
Part (b) is similar to a demonstration from class, and numerous example and practice problems in texts.  They know to draw a free body, calculate the buoyant force using Archimides' principle, and use the free body to calculate the tension in the string connected to the scale.  The only halfway tricky part is finding the volume of the iron, which is easily done once the density of iron is looked up.  The buoyant force is about 2 N in this case.
 
Part (c) is the part that causes trouble.  Most of the class, at least initially, says that the reading on the platform scale is just 30 N -- the weight of the oil plus the weight of the beaker.  Others get the right answer of 32 N, but for crazy reasons.  Some come to the conclusion that since the oil "lost" the 2 N buoyant force, that we must return these 2 N to the oil through the reading on the platform scale by conservation of force.  Others simply draw the buoyant force acting down directly on the beaker.  Many make no argument whatsoever, but just add in 2 N, presumably because their friends told them to and they couldn't quite explain it. 
 
I'm glad that so many students have the physics instincts to recognize that 30 N can't be right.  A few will say they made a lucky guess, but I consider such a guess good physics intuition.  However, only a very few students get the justification for why the platform scale reads 32 N.  Do you know?
 
It's Newton's Third Law.
 
The buoyant force is the upward force of the oil on the iron.  Therefore, there must be a downward force of the iron on the oil.  When we consider the oil-beaker system, the downward forces sum to 32 N, including the weights of the oil and beaker, and the third law companion force to the buoyant force.
 
Do you believe me?
 
My students don't, at least not if they didn't get the answer right in the first place. So I set up a similar situation.  The picture at the top (credit to Frederic Lamontagne, WFS class of '11, for the photography) shows a beaker containing a submerged aluminum weight, just like in the problem.  When I remove the weight from the water, the reading in the spring scale increases, but the balance scale goes out of balance!  I have to rebalance the scale to make up for the removal of that downward force of the aluminum on the water.  Since the spring scale reading increased by 0.2 N, I had to add about 20 g to the balance scale reading.  Physics works.
 

10 November 2010

HOW MUCH? The heck you say.

We're studying circular motion in regular physics, and I'm preparing my laboratory activity for the week after Thanksgiving break.  (Not sooner -- we have our trimester exams next week.)  I want to do the "swing a stopper on a string in a horizontal circle above your head" experiment, a classic developed in the PSSC era.  I discovered my setups for this experiment to be a tangled mess, with numerous missing pieces, broken strings, and not enough hollow tubes for the string to go through in any case.  Now you can tell why I haven't done this experiment with my class in about five years.

I looked on the PASCO site, hoping to find a reasonably priced set of hollow tubes with stoppers and the light, low friction thread that leads to quality data.  And what to my eyes did appear:  $39 big ones for a set of five stoppers, two tubes, ten zip ties, and some regular old string. 

Okay, my department's budget is nearly unlimited.  I can -- and do -- order any equipment I want or need for my class.  Nevertheless, there's something to be said for intelligent use of resources.  $39 for items available in the storeroom?  Neither frugal nor intelligent.  This is why a former Chief Reader for the AP exam defined "Pasco" as a Latin verb meaning "to rob."*

* Before the Pasco Police come my way, please note that I am a HUGE customer, and a huge supporter of the company in general.  They sent me two loaner heat engines for my summer institutes -- no charge, no hassle, no problem.  (Of course, I probably garnered them 5-10 orders for said heat engines, so they got their money's worth.)  I tell anyone who will listen how reliable PASCO's products are, and how good their technical support is.  But the downside:  they're expensive.  And in this case, obnoxiously expensive.

I had no trouble finding stoppers, thread, and zip ties.  I'm going to use thread from Burrito Girl's* sewing kit rather than regular string; the chemistry department has stoppers of all sizes.  The trick was finding the hollow tubes without a trip to the hardware store.

* Burrito Girl is my wife and sidekick. 

My classroommate Alex Tisch looked at the picture, and offered up a suggestion that would make the editors of the Tightwad Gazette croon:  what about a BIC pen with the ink part removed?  Two decades ago I used to take apart these pens when I was bored in class... now I could use that experience to save my department some dough. 

In the event, I used a papermate brand pen.  The pen-tip is connected to a thin tube of ink, all of which can be removed from the pen casing easily; the cap on the other side took some wedging, but I got it out with a fingernail in less than one minute.  Voila, a "hollow tube," at a cost of about a quarter.

(Oh, you want to know about the actual experiment?  Attach the stopper to the string with the zip-tie, thread the string through the tube, and hang a mass from the bottom end of the string.  Hold the tube and swing the stopper in a horizontal circle at constant speed such that the hanging mass hangs in equilibrium.  The radius of circular motion can be measured with a ruler.  The speed of the mass can be determined with a stopwatch, knowing that speed is circumference divided by the time for one revolution.  A graph of speed squared on the vertical axis and radius on the horizontal axis yields a line whose slope is the centripetal acceleration of the stopper.  This acceleration can be shown to be equal to g times the ratio of the hanging mass to the stopper mass.)

GCJ

05 November 2010

General Physics Lab: Time of Flight for a Projectile

I've been working this year on developing laboratory exercises for general physics that involve simple data collection and straight lines.  I want to drill the idea of taking a slope of a best-fit line, and interpreting the physical meaning of that slope.

I've already discussed the classic ball-off-of-a-table projectile lab, for which David Moore recommended using a photogate to measure the ball's horizontal speed.  The traditional experiment controls for the horizontal speed, and asks students to predict the landing spot on the floor. 

I tried something different, because I wanted a graph.  I had the students measure the initial horizontal speed with the photogates... but then I had them measure the horizontal distance that the ball travels after flying off of the table.  They could make these measurements for a wide range of initial ball speeds.  I asked them to graph the landing distance on the veritical axis of a graph, and the velocity read from the photogates on the horizontal axis.

My class did a pretty good job of data collection. At this point, they're already quite good at drawing a best-fit line, at calculating the slope of the best-fit using two points on the line that are not data points.  Some even put proper units on the slope.  (The idea that a slope has units is, for some reason, a difficult concept to get across.)

What we're NOT yet good at is understanding the physical meaning of the slope of an experimental graph.

When I ask someone what the slope of this graph means, he invariably says "the slope is the change in the distance divided by the change in the speed."  Well, sure, but that's a mathematical answer.  I know that a slope is rise over run.  What's interesting and exciting is that the slope has a meaning beyond rise over run, which can only be determined with reference to the relevant equation.

The horizontal speed is constant; so speed = distance / time.  Some algebra rearranges this to time = distance / speed.  Well, distance / speed in this case is rise / run -- The slope is the time for the ball to fall to the ground.

One student's data is shown above.  The slope of his graph was 0.37 s.  The table from which he launched the ball was 72 cm high, predicting a time of fall of 0.38 s -- not bad, eh?

GCJ

03 November 2010

Circular motion demonstration: turntable

When I arrived at Woodberry Forest eleven years ago, I discovered several 1970s-vintage turntables in the storeroom.  I turned one into a nice, quantitative, circular motion demonstration.

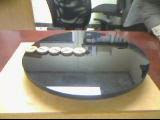
In the picture you see the turntable, with five identical brass masses placed on top.  Before I start the demonstration, I show the class that a brass mass placed right near the center stays put when the table rotates; but the same mass placed near the outer edge flies off.  The goal of the demonstration is to predict the maximum radius for which the mass will not fly off.

The friction force on the brass mass acts toward the center of the rotation, and is a centripetal force equal to mv2/r.  The variable r represents the radius of the circle -- that's what we're looking for here. 

Problem is, the speed v itself depends on r, because a mass near the edge covers a larger distance in the same time as a mass near the center.  So we write v in terms of the period of revolution, Tv = 2πr/T.  The period of revolution is measured with a stopwatch.

The friction force can be set equal to μFn.  The normal force on the mass is simply its weight.  The coefficient of (static) friction must be measured... but I can do that with a spring scale or a force probe.  I pull a stack of brass masses with the scale.  I divide the reading in the scale just as the masses start to move by the weight of the stack of masses. 

(Here the class can be asked whether the coefficient of friction for a single mass will be greater, less than, or the same as that for the stack of masses.  Answer:  the same, because we still have brass in contact with the same surface.  I only use a stack of masses to make the spring scale reading easier to obtain.)

So now we know everthing in the relevant equations necessary to solve for the radius r.  We find that radius to be in the neighborhood of 4-5 cm.  That's in the middle of the second mass, as measured from the center.

What does this mean experimentally?  When I turn the turntable on, the outer masses should fly off, but the first one or two should stay put.  And sure enough, that's what happens -- physics works.

Follow-up:  Next I replace the 20 g brass masses with 10 g brass masses from the same set.  Which ones should fly off now?  Answer: still, the masses more than 4-5 cm from the center will fly off, the others will stay put.  The coefficient of friction still hasn't changed, because we're using the same surfaces.  Mass cancels out when solving in variables, so the mass doesn't matter.  Sure enough, the 10 g masses fly off outside of 4-5 cm, as predicted.

GCJ

02 November 2010

Grousing about Newton's Third Law

I've heard all sorts of bright ideas about teaching Newton's Third Law.  I've even tried a few myself. 

One gentleman, whom I saw at a Florida AAPT meeting back in 1997, actually brought out a wooden model of a pair -- the fruity kind.  He explained that "forces come in pairs..." and opened up the pair to show, inside, two force vectors labeled F (A on B) and -F (B on A). 

That's clever and laugh provoking, but not particularly useful.  It's not getting students to remember Newton's Third Law that's tough -- it's getting them to use it correctly.  Me, I tend to shy away from the videos, from the cutesy pictures of faces being punched (and delivering a punch to the fist!), and so on.  But I certainly don't have a magic formula for teaching this simultaneously easiest and toughest of laws.

As an example of the uphill battle we face teaching the third law, I'll tell a story of my own inadequacy.  I'd love some advice.

I taught the third law this year to my general physics class.  In the past I've restricted the third law to my AP sections, but I decided to give it a go... and that go turned into a full stop.

My classroom presentation was, I thought, strong and straightforward.  I wrote Newton's Third Law on the board as "the force of A on B equals the force of B on A."  In discussion with the class, we emphasized the difference between an object experiencing a force and an object applying a force. 

One useful technique I have discovered is to insist that all forces be described in what I call "Newton's Third Law Language" before approaching a question.  When asked for the third law pair of the "normal force," students are up a creek; but when asked for the third law pair to the "force of the table on the block" they can handle themselves.

So in class we practiced describing forces in Newton's Third Law Language, and then finding the third law pair.  I used check-your-neighbor questions, I called on some folks randomly, I led a discussion, answered questions... all the usual techniques to make physics lecture effective.  I even specifically addressed the companion forces to an object's weight, and to a normal force.

(The one thing I didn't do is the quantitative demonstration -- that's coming shortly.  I'm attaching two force probes to two different-mass carts, and showing that the probes read the same thing when the carts collide with each other.)

On the nightly homework, I began with a conceptual question:  Can a Newton's Third Law force pair act on the same object?  Everyone got this right.  Good start, I thought.

The next homework question asked to identify two equal and opposite forces that were NOT third law pairs.  Students struggled with this one -- many said that such a thing cannot exist.  Maybe I should have asked that question later. 

Finally, I showed a kid dragging a sled across a rough surface.  I asked for the Newton's Third Law companion force to the normal force, the weight, the tension in the string, and friction.  Remember, we had done two of these THE SAME DAY, IN CLASS.

Do you know, only one person out of 22 got all of these correct? Well, I know.  Their performance stunk.  They all said that the normal force's companion was the weight; that the tension's companion was friction.  BOUX!!!!! 

I have confidence that, after enough iterations, most of my class will eventually be able to answer Newton's Third Law questions correctly.  I know that I have to be patient, I have to make the class confront their misconceptions by getting problems like this wrong, I have to ask the same questions in as many different ways as possible.

Nevertheless, I ask the reading audience:  has anyone had success teaching Newton's Third Law quickly?

GCJ

(Picture at the top from The Physics Classroom.  Visit this site -- it's good.)

25 October 2010

Lab idea for general physics: introduction to force components

 I had just introduced the idea of a force acting at an angle in my general physics course.  I needed an experiment for lab day.

In general physics lab, I want as often as possible to be able to make a linear graph, and use the slope or intercept to calculate a verifiable physical quantity.  The data collection process should be as simple as I can make it -- very little messing with computers, with minimal calculation before the linear graph appears.

My first thought was to use the PASCO fan cart.  The fan can blow straight ahead, or can blow at any angle all the way to 90 degrees off of straight ahead.  If we place this cart on a PASCO track --  with grooves keeping the cart from sliding -- a spring scale attached to the front of the cart can measure the force the cart experiences in the direction of the track.  This force would be equal to the force of the fan times the cosine of the fan angle.  A graph of the scale reading vs. the cosine of the fan angle would make a line whose slope is the force of the fan.

Problem is, I have 22 students and 11 lab groups.  I don't even have two fan carts, let alone 11; that many fan carts would bust my budget.

After considerable brainstorming with some AP physics alumni, a new thought occurred to me... what if I could keep the angle of an applied force constant?  Look at the lower picture, the picture of the red PASCO cart.  This is one of the newer plastic "pascar" models.  It has several convenient raised thingamabobbers (that's a technical term) useful for attaching strings. 

One string is attached to the middle of the left-hand side of the cart.  This string is passed over a pulley, and a hanging weight is hanged from the string.  A second string is held across the diagonal of the rectangular pascar, as shown in the picture.  The geometry of the pascar itself determines this angle -- students are instructed to ensure that the rope stays along the diagonal to control the angle.  A spring scale is attached to the angled rope.  The top picture shows the Nachoboy holding the spring scale at the correct angle; the hanging weight is visible above the garbage can.  Component analysis shows that the hanging weight is equal to the tension in the angled rope times the cosine of the string's angle.

Students vary the hanging weight, and measure the tension in the angled rope with the scale.  They graph the hanging weight vs. the tension in the angled rope.  The slope of this graph should be the cosine of the angle of the string!

Each student used the slope of his graph to figure out the angle of the rope.  I measured the angle with a protractor... I got between 21 and 24 degrees, depending on where the rope was anchored.  Those who did the experiment carefully (most of the class) got a slope of 0.90-0.95... giving an angle between about 18 and 25 degrees.  Woo-hoo!

GCJ

20 October 2010

Don't be lazy when acquiring laboratory data

I spent last weekend in the company of about 25 AP physics teachers from Virginia public schools.  We had a good time discussing quantitative demonstrations and grading to a rubric.

One teacher asked me about the Archimedes Principle laboratory exercise that I've published.  Basically, I graph the amount of mass floating in a cup as a function of the volume of water displaced.  From the slope it's possible to get a value for the density of water.

This teacher was concerned... his students' measured densities varied all over the place, in many cases exceeeding the density of gold.  We talked about experimental technique, and I gave him some hints there.  (It's important to be absolutely sure the cup is filled to the brim.)  But he was doing a reasonable job with the procedure, and he shouldn't have had such a crazy spread of densities.

Then I asked him about his students' analysis.  I wondered how linear their data were.  It came out of the discussion that his students were measuring the displaced volume for just 4-5 different floating masses.  THERE'S THE ISSUE!

When my classes come to the first lab of the year, they expect to take 4-5 overly precise data points, and then spout some baloney about "human error" being why their result is lousy.  It takes a couple weeks of me riding herd and establishing the proper tone in order to get good, solid results.  Some of my rules for laboratory include:

1. No one leaves early; no one may work on anything but physics during the entire 90-minute lab period.  So there's no hurry to get done.

2. Data is placed directly on a graph as acquired. We do not make a table of values to graph later.  Why not?  (a) See rule #1.  (b)  It's hard to convince a student who's put everything away and *thinks* he's alredy done to do more work.  If they're graphing as they go, then it's easy to see when the graph looks complete, or in which range more data needs to be acquired.

3.  The standard for a "complete" graph isn't a certain number of points.  Rather, it's the "little brother" standard -- could your 6 year old little brother look at the graph and tell INSTANTLY whether it's a line or a curve?  And would all his little 6 year old friends agree with him unquestionably?  If not, more data is necessary.

4.  It's not acceptable to measure the same data point twice.  Consider a period of a pendulum experiment.  My students' instincts at the beginning of the year are to measure the period for five different lengths, and to time each length 4 or 5 times.  That's silly... why not just make a single measurement of the period for each of 20 different lengths?  Any "errors" in timing will smooth out over the entire graph.

5.  NO PUTZING.  Early on, I go through the class speeding the data acquisition process.  For example, partnerships will spend 15 minutes arguing whether to measure periods for every 5 cm of string length, or for every 10 cm.  If they had just started measuring, they would have had time to measure every 2 cm! 

Look at the graph above.  I deliberately cut off the axis labels, becuase the issue is the number and linearity of the points.  Graphs for all experiments look this way.  Most of my experiments require a good hour plus for data aquisition.  That's time well spent, becuase then the analysis goes smoothly with minimal deviation from the answers I expect.  As the year goes on, data aquisition becomes smooth, effortless, and fast.

Try it -- lab should be a fun and relaxed experimental investigation, not a race to see who can just get the friggin' thing done first.

GCJ

13 October 2010

Gravitation and Newton's Third Law Quiz

We've just finished covering Universal Gravitation.  Last night, my class did a problem involving a geosynchrous satellite orbiting Jupiter... they were to calculate the altitude of the satellite, and compare that altitude to the radius of Jupiter.

Today's quiz deals with conceptual issues from this problem, and reinforces Newton's Third Law (which we've been hammering for a week now).  I particularly like the last question, the ranking task -- it forces students to think beyond a single force pair.  They must combine their understanding of gravitation AND the Third Law.

Note that this quiz can be given in longer form or as a homework problem, just by adding the phrase "justify your answer" to the end of each question.

Space probe A orbits directly above Jupiter’s red spot, 9000 km above the surface. Identical space probe B sits on the surface of Jupiter.


27. Which probe has the bigger period of revolution?
(A) Probe A
(B) Probe B
(C) Both have the same period

28. Which probe has the bigger speed?
(A) Probe A
(B) Probe B
(C) Both have the same speed


29. Which probe has the bigger acceleration toward the center of Jupiter?
(A) Probe A
(B) Probe B
(C) Both have the same acceleration

30. Rank the magnitudes of the following gravitational forces from greatest to least. If two or more quantities are the same, say so clearly.

I. the force of Jupiter on space probe A
II. the force of Jupiter on space probe B
III. the force of space probe A on Jupiter
IV. the force of space probe B on Jupiter
V. the force of space probe A on space probe B
VI. the force of space probe B on space probe A


greatest ___ ___ ___ ___ ___ ___ least

05 October 2010

Universal Gravitation -- instructions and strategy

It's time to discuss universal gravitation.  Since quantitative demonstrations won't work here -- what, you want to hook a spring scale to the moon to verify the force the earth is exerting on it? -- I make some calculations with interesting results.

First, I calculate the gravitational field g, and show that g is still the same value at the top of Mount Everest. 

Next, I calculate the force of the earth on the moon using universal gravitation.  We get 1017 N.  As a check on that calculation, I use circular motion (which we have just finished covering):  I find the centripetal force required to keep the moon in its orbit.  We get the same answer... and then we discuss how the combination of circular motion and universal gravitation allows calculation of all sorts of astronomical quantities. 

A quiz a few days in asks to find the mass of the Milky Way galaxy, given the sun's orbital period around the center, assuming a two-body problem and circular motion. This calculation gives an accurate result, despite the crazy assumptions.

Throughout the unit I am modeling ORDER OF MAGNITUDE ESTIMATION.  I don't ever pound the calculator, and students are forbidden from having calculators on their desks.  Instead, I just write every calculation in scientific notation in standard units.  From that, I cancel powers of ten in my head, and write the answer to zero or one significant figures.  And, we check the reasonability of all answers where possible by direct comparison to known quantitites -- for example, if we calculate the mass of a star, we compare that to the mass of the sun.

Below are the instructions I write out on my problem sets for universal gravitation.  I follow through on my demands, too -- a problem without an order-of-magnitude estimate written out loses at least 3 out of 10 points.  The nebulous and meaningless statement "that's a really huge mass" rather than "that's 1/10 the mass of the sun, so reasonable for a star" loses 3 of 10 points. 

Topics to be discussed: Newton’s law of universal gravitation. I find that, amazingly, the biggest trouble that students have when solving universal gravitation problems is plugging correctly into their calculators. To be sure you don’t screw up, follow this advice:

• Solve in variables as far as possible in each problem. Only plug in values at the end.


• Do an order of magnitude estimate of your answer without the calculator, to be sure you’re not way, way off.


• Check the reasonability of the answer. When you’re asked to make a comparison, do this right – don’t just say “that’s a big mass”, say “that’s twice the mass of the earth” or “that’s close to the mass of the sun”. Astronomical data is easily available online, and there are astronomical tables in all physics texts.


• I will be looking at comparisons VERY CAREFULLY on gravitation problems. Do these right.


29 September 2010

Two-body problem quantitative demonstration

Consider the classic two-body problem, in which a cart on a horizontal low-friction track is attached via rope-and-pulley to a hanging mass.  The cart has mass 340 g, and the hanginging mass is 100 g.  I release the cart, which speeds up.

Is the tension in the rope...
(A) greater than 1 N
(B) less than 1 N
(C) equal to 1 N?

"Equal," say a majority of the students -- because the rope is attached to the 100 g hanging mass, which has a weight of 1 N.

"Less than 1 N," the cleverer ones respond.  The hanging mass has a downward acceleration, because it is moving down and speeding up.  So the down forces must be GREATER THAN the up forces, meaning the tension is less than the 1 N weight.

"Let's see," I say.  The picture shows my cart with a Vernier force probe taped inelegantly on top.  The string is attached to the force probe, is run over a low-friction Pasco pulley, and connected to a 100 g hanging mass.  I tell Vernier's Logger Pro software to collect force probe data.  Before I let go of the cart, the probe reads 1.0 N.  As soon as I let go, the force probe's reading very obviously dips, to something like 0.7 - 0.8 N.  Looks like the cleverer ones were right.

Next, I use free body diagrams and Newton's second law to predict the acceleration of the cart and the tension in the rope -- I get 2.3 m/s2 and 0.77 N.  Sure enough, that's just about what the force probe and a motion detector read.  (I get the acceration from the slope of a velocity-time graph, which I make with the vernier motion detector.)

Next question:  Instead of letting the cart go from rest, I give the cart a shove to the right, away from the rope. 

After I let go but as the cart is still moving to the right, is the tension...
(A) greater than 1 N
(B) less than 1 N
(C) equal to 1 N

"Greater than 1 N," say the majority.  "The hanging mass is now moving upward, so the up forces must be greater than the down forces."

"Nonsense," I say.  The mass is slowing down while it moves upward.  Slowing down means that acceleration and velocity are in opposite directions.  Thus, the acceleration must still be in the downward direction, and the tension must still be less than the weight.

In fact, the entire set of free bodies is unchanged from the previous problem -- the force that I pushed with doesn't act once I let go!  So, all calculations are the same, and the acceleration and tension should be unchanged.

Of course, I finish the class by doing the experiment -- sure enough, the tension and acceleration readings are the same as before.

GCJ